
Explainers / CANVAS
Ranked bars
A small ranked chart animates between two supplied snapshots of data.
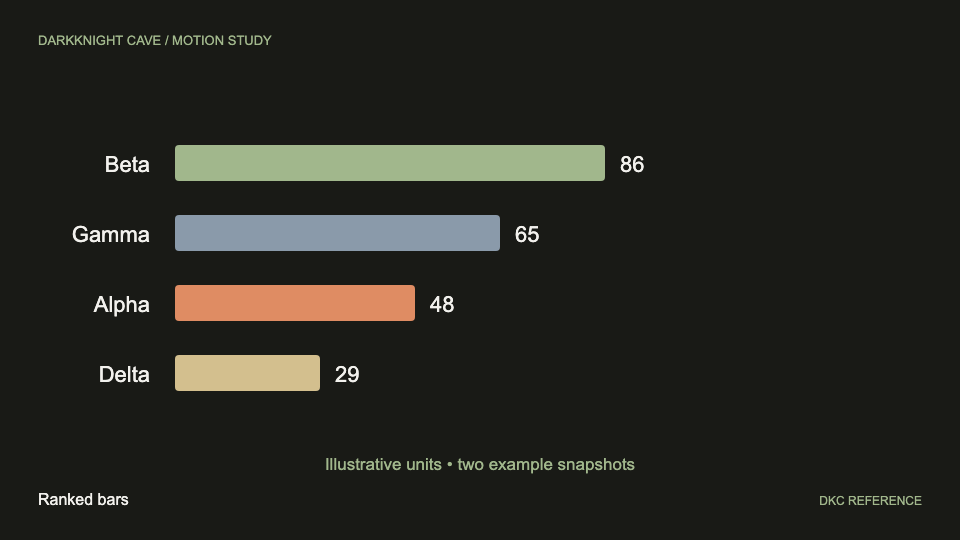
DKC reference implementation; not an original creator video. You can play, pause, and inspect time in the reference.
Make it fit your project.
Build an eight-second horizontal bar chart for four supplied categories. Interpolate numeric values between two snapshots, sort rows at each frame, and ease each row toward its current rank. Keep labels and values outside the bars and use a shared fixed axis.
Build and check.
- Confirm the supplied content, target environment, and required assets before implementing.
- Build an eight-second horizontal bar chart for four supplied categories. Interpolate numeric values between two snapshots, sort rows at each frame, and ease each row toward its current rank. Keep labels and values outside the bars and use a shared fixed axis.
- Expose seek(t) so frames can be inspected deterministically; add play, pause, replay, and a reduced-motion still.
- Inspect the opening, midpoint, and final state at desktop and mobile sizes; report any dependency or output limitation.
Know the limits.
- Show units, dates, and source. Never change the axis scale silently to exaggerate differences.
- The prompt guides a coding agent; output quality depends on its implementation and review.
Want us to build it?
Send an optional project brief. We’ll receive your contact details, project description, and this recipe’s ID.
Catalog 2026-10-22.a82e12098f76 · Source revision sha256:dfbe6519cbc4fc84acc4cbf926d8a01c7f2e248dd46cedd67a9112b0e928c2ba